Explore how scalar fields rise, form basins, and change together on a graph. gflow helps you follow peaks, overlapping supports, and trajectories in structured data, and compare local changes between fields.
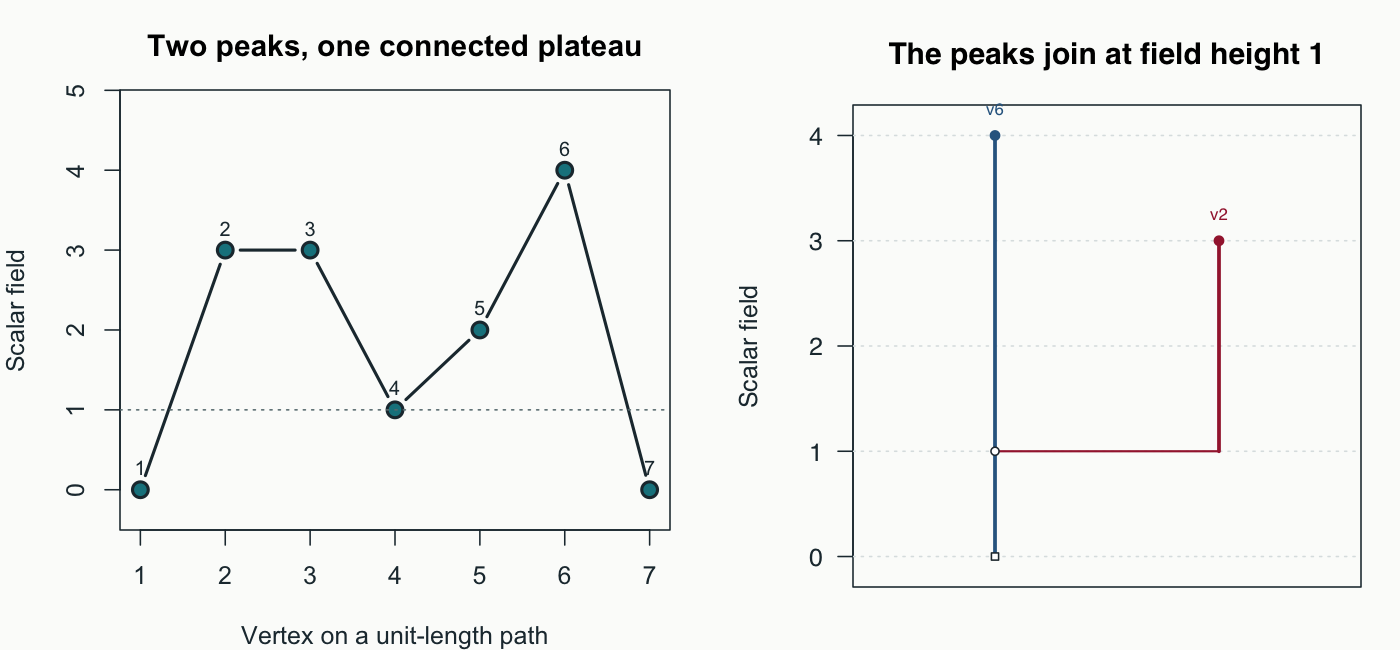
Two peaks, one hierarchy. The plateau peak is born at height 3 and joins the higher peak at height 1. The tree records this relationship; its branch lifetimes are in field units, not significance scores. Reproduce the figure · Start an analysis · Explore the example graphs
Install with help and guides
This is the unreleased 0.2.0 development package. Build from a source checkout with R, a C++17 compiler, GNU make, and Pandoc (also supplied with RStudio). R >= 4.1.0 and dgraphs >= 0.2.0 are required. The graph boundary supports both the published 0.2.0 list API and the tested 0.3.0.9000 object API.
This installs missing core/build R dependencies, generates function help, builds all four vignettes, installs the source archive, and checks the installed introduction. It uses your current R library configuration. For a library you control, create a directory and set R_LIBS_USER before running the command. Optional viewers and archived modeling packages are not needed for this route.
Then, in R:
A plain Git/local installation that skips the Makefile’s documentation step can omit generated help and rendered guides. Use the route above, or install a source archive produced by make build. See installation details for manual steps, library selection, and optional OpenMP toolchains.
A first result
This small example reproduces the structure in the opening figure. Each adjacency entry has an aligned list of edge lengths; the field has one value per vertex in the same order.
library(gflow)
adjacency <- list(2L, c(1L, 3L), c(2L, 4L), c(3L, 5L),
                  c(4L, 6L), c(5L, 7L), 6L)
edge_lengths <- lapply(adjacency, function(v) rep(1, length(v)))
field <- c(0, 3, 3, 1, 2, 4, 0)
bc <- create.basin.complex(
  adjacency, edge_lengths, field,
  method = "superlevel_merge_tree", direction = "max"
)
get.basin.table(bc)[, c("extremum.vertex", "persistence", "raw.support.size")]| Peak vertex | Persistence (field units) | Raw support (vertices) |
|---|---|---|
| 2 (plateau at 2–3) | 2 | 2 |
| 6 | 4 | 7 |
The root support includes the younger branch, so these supports overlap. Change the field and reconstruct bc to see how the hierarchy changes.
summary(bc)                         # Rankings, coverage, and diagnostics
get.basin.membership(bc)             # Raw overlapping membership
get.basin.assignment(bc)             # Current single labels, when available
plot(bc, view = "merge_tree", type = "tree",
     label = "extremum.vertex", show.mass = FALSE, show.support = FALSE)
For graph maps, supply drawing coordinates to plot(bc, view = "assignment", coordinates = xy) or view = "overlap". plot(bc) shows the input field against vertex index. A drawing does not change the analysis.
Choose the next task
| Task | Start with | Guide |
|---|---|---|
| Choose a basin definition | create.basin.complex() |
Canonical workflow |
| Understand overlap, cuts, and refinement |
get.basin.*(), cut(), summary()
|
Paths, grids, and disconnected graphs |
| Follow trajectories or extend coordinates |
construct.madag(), compute.harmonic.extension()
|
Task map |
| Compare local changes between fields |
lcor(), lslope(), lslope.neighborhood()
|
Noisy-circle workflow |
Function reference · Full task and API catalog · Guide sources · Release notes
All four guides are installed locally. Use browseVignettes("gflow") for the index and help("gflow-migration", package = "gflow") for migration advice. Loading the package stays quiet.
Package boundaries
Build graphs with dgraphs, then supply adjacency and aligned edge lengths. gflow owns basin/flow analysis and local association. Layout and interactive viewers are optional and separate. Retired response-smoothing estimators are archived in gflowx.
gfcor() and gfassoc.membership() currently require compatible archived basin objects and reject canonical basin_complex inputs. They are not a continuation of the new-analysis example above. See REFERENCE.md and the migration guide.
Development and documentation
To rebuild the website from a matching installed archive, install pkgdown and run make website with the same R_ENV library selection used to install that archive. Generated pages live in build/site/; maintained installation notes in docs/ are preserved. See the documentation build guide.
The developer map locates implementations, scientific regression tests, ownership records, and resource limits.