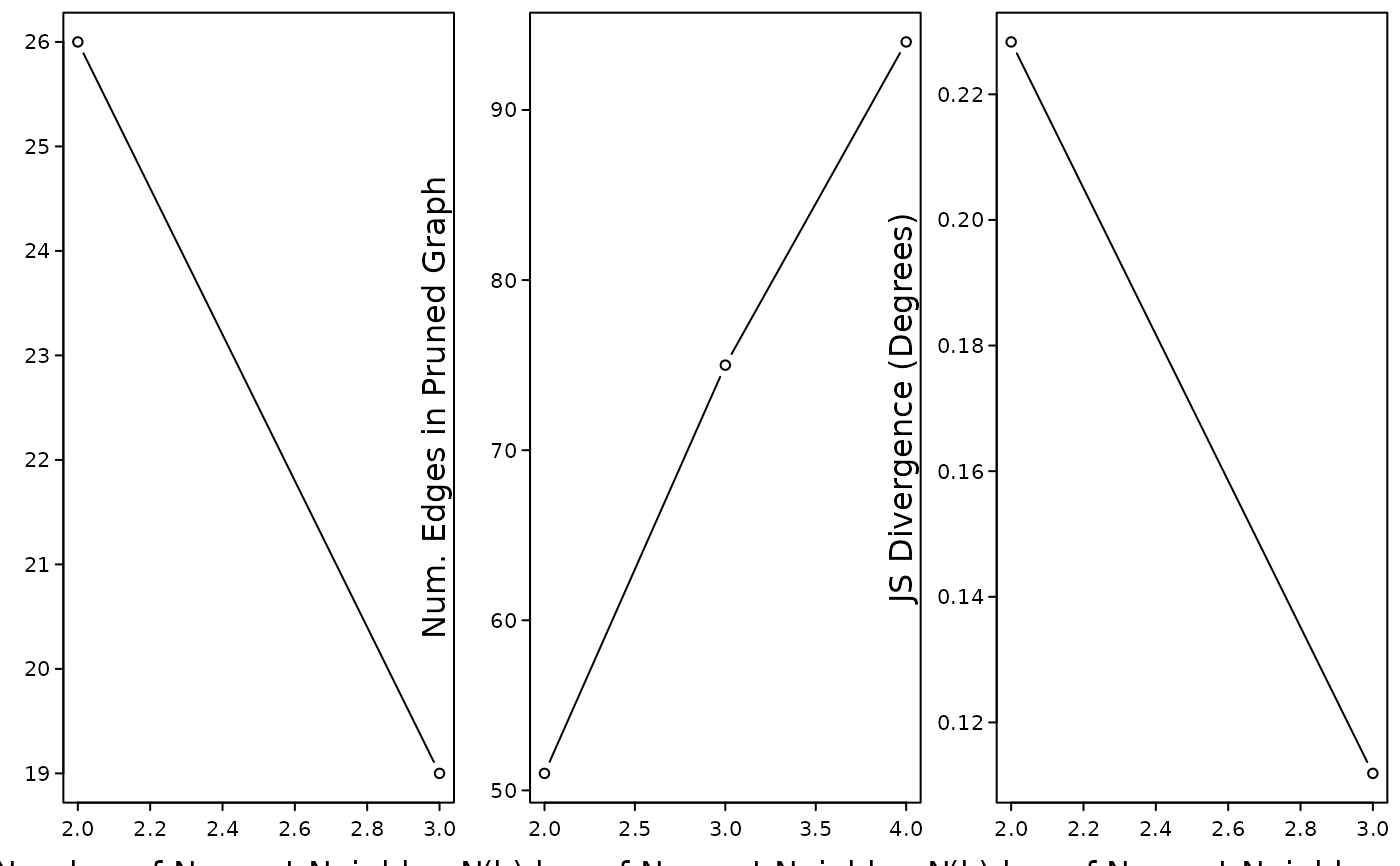
Plot Method for IkNN Stability Metrics
Usage
# S3 method for class 'iknn_stability_metrics'
plot(x, ...)
Arguments
- x
An object returned by
compute.stability.metrics().- ...
Passed to
plot.IkNNgraphs().
Examples
set.seed(1)
X <- matrix(rnorm(60), ncol = 2)
graphs <- create.iknn.graphs(X, k.values = seq.int(2, 4), compute.full = TRUE,
    verbose = FALSE)
stability <- compute.stability.metrics(graphs)
plot(stability, with.pwlm = FALSE)