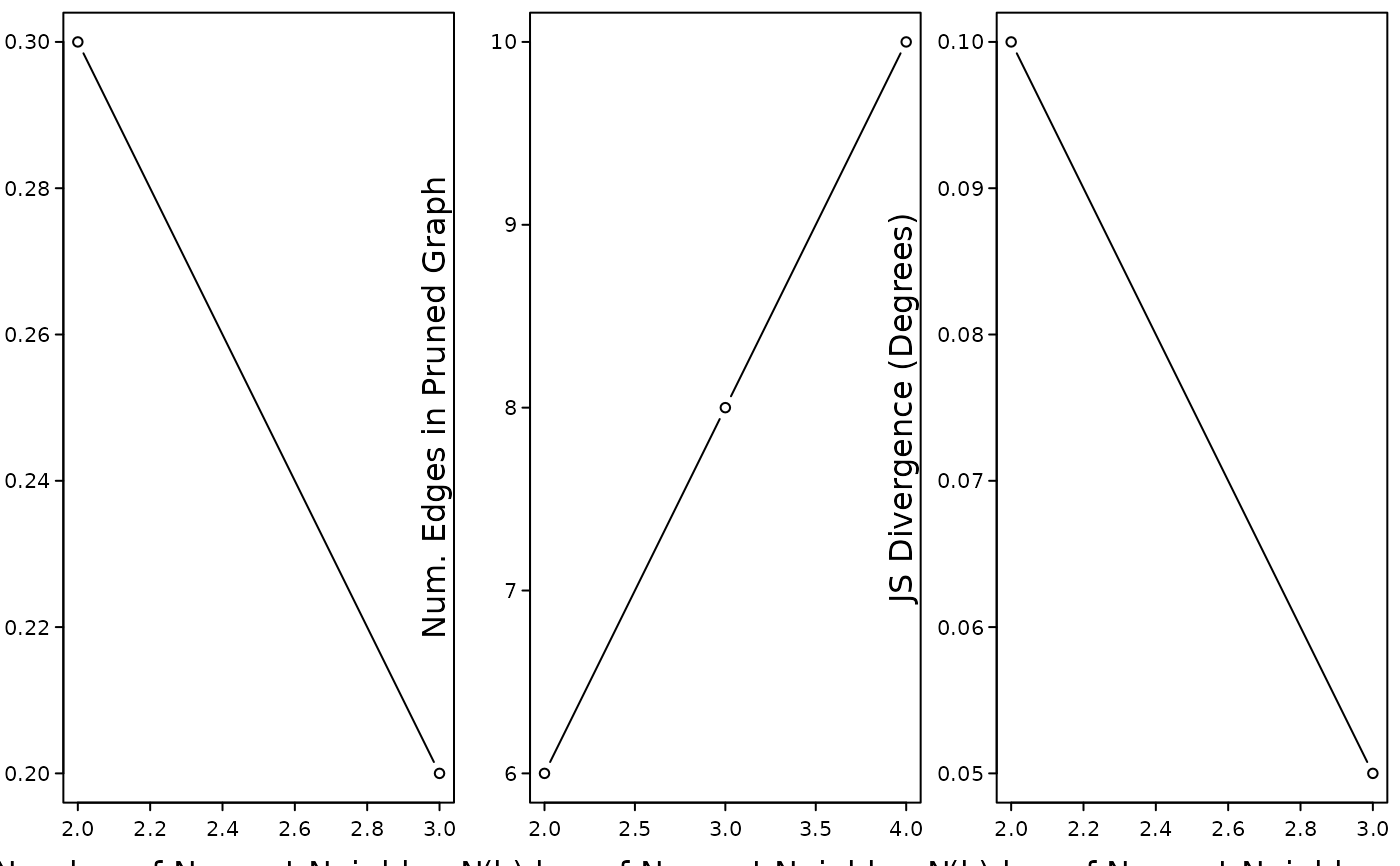
Plot Diagnostics for Intersection k-NN Graph Analysis
Arguments
- x
A list with
k.values,edit.distances,n.edges.in.pruned.graph, andjs.div.- type
Character string. Only
"diag"is currently supported.- diags
Diagnostic panels. The supported combination is
c("edist", "edge", "deg").- with.pwlm
Logical. If
TRUE, overlays smoothed trend fits.- with.lmin
Logical. If
TRUE, shows local-minimum vertical lines.- breakpoint.col
Color for breakpoint vertical lines.
- lmin.col
Color for local-minima vertical lines.
- mar, mgp, tcl, xline, yline
Base graphics controls.
- ...
Additional arguments passed to plot.