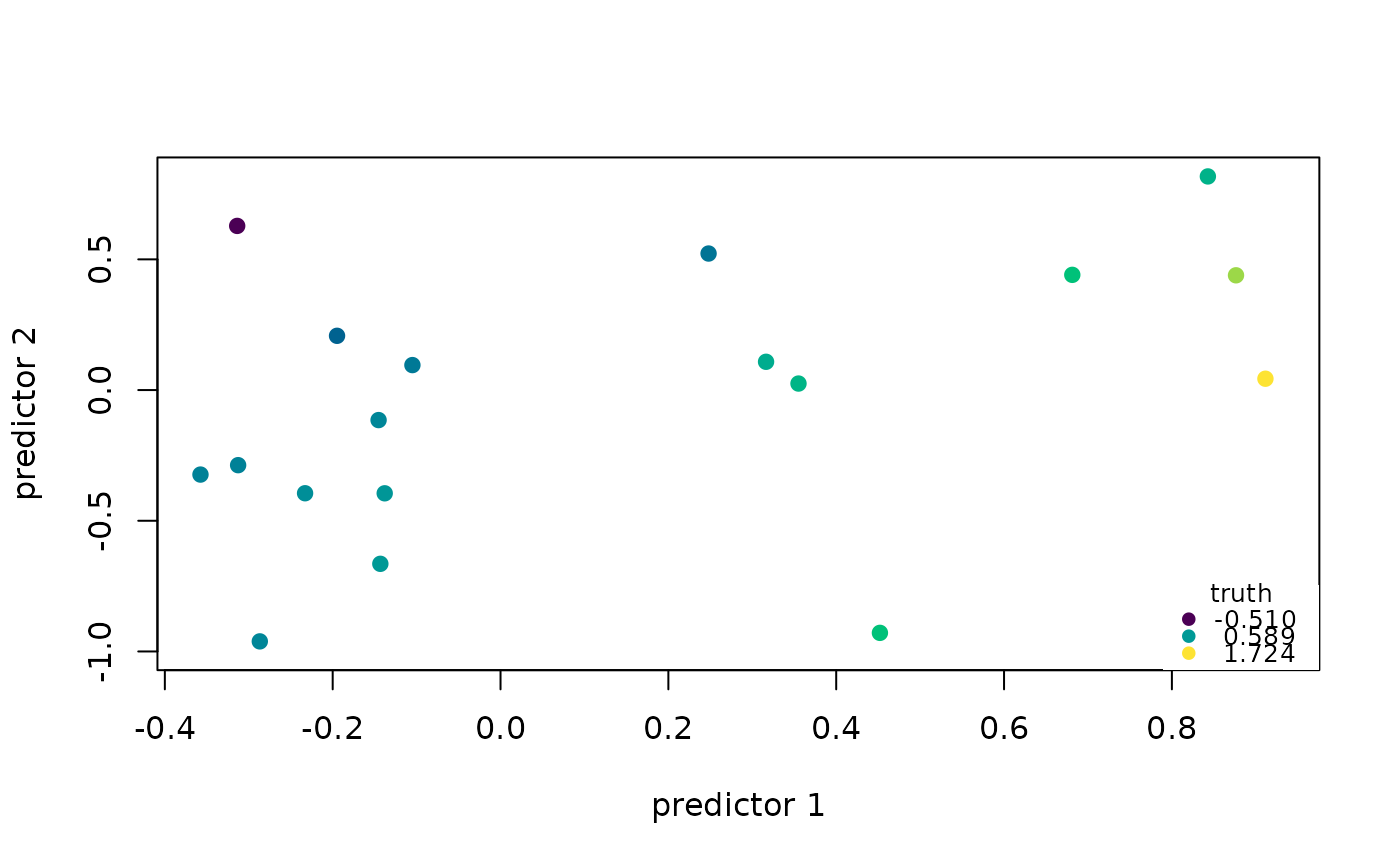
The default view = "auto" preserves the dimension-dependent display:
one latent coordinate shows response and truth against that coordinate;
otherwise the first two predictor coordinates show a geometry projection.
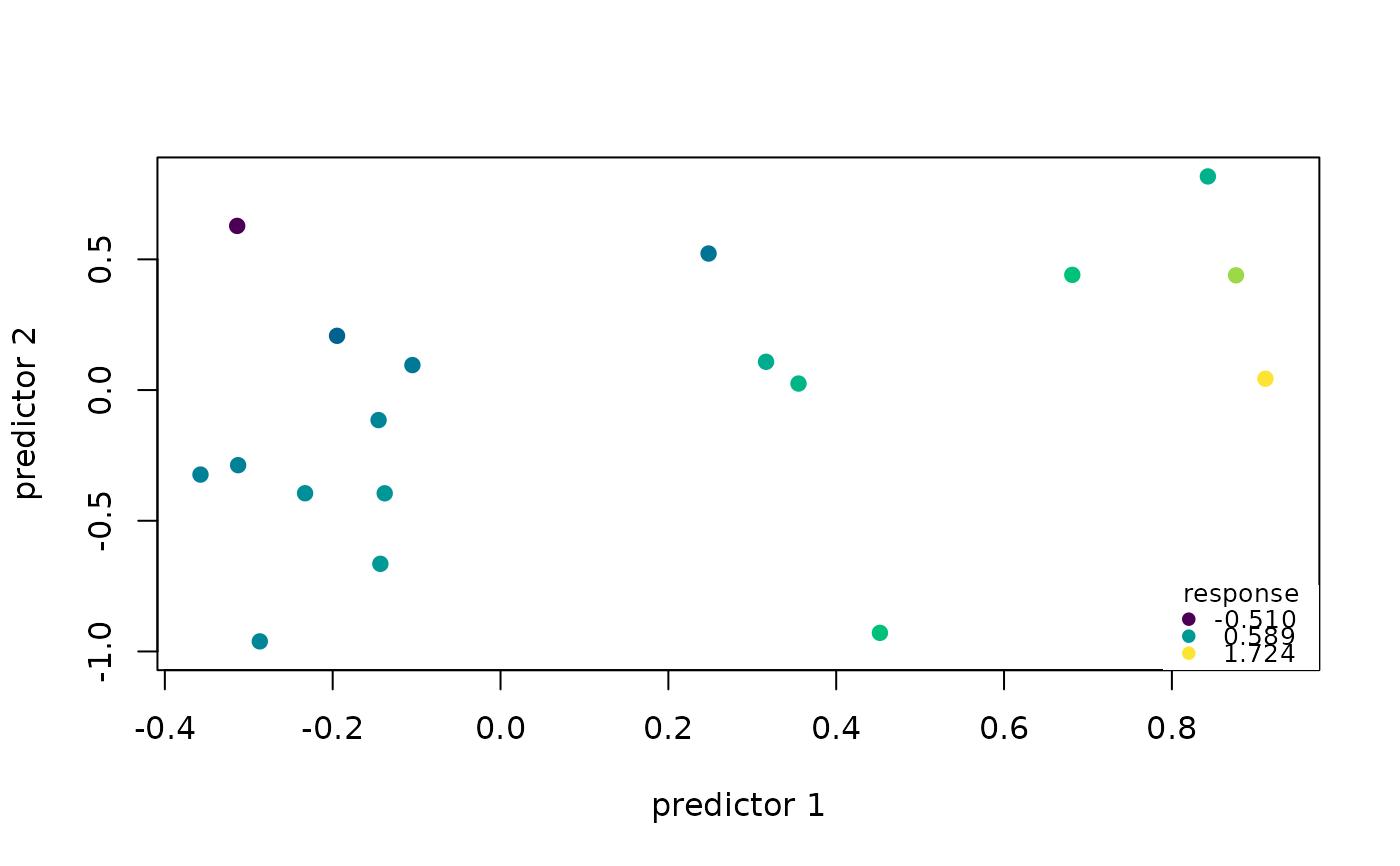
Select "geometry" explicitly to see a curve's embedding, or "response"
to see responses against the first latent coordinate (observation index when
latent coordinates are absent). A two-coordinate projection can hide
separation in higher ambient dimensions. Plotting does not draw random values.
Arguments
- x
A
synthetic_dataset.- color
Color mapping for points: response, truth, or region. Region mapping requires stored region labels. Numeric keys display the actual range.
- ...
Additional arguments passed to
graphics::plot(), including overrides for axis labels, point shape, or color.- view
"auto","geometry", or"response". Geometry requires at least two predictor coordinates. Named-only, after..., for compatibility.- legend
Logical; show point-color and response/truth keys. A user-supplied
colsuppresses the automatic color key.- col
Optional explicit point color, overriding the color mapping.
Examples
x <- materialize.synthetic(synthetic.registry.spec("G1"), n = 20L, seed = 1L)
plot(x)
 plot(x, view = "geometry", color = "truth")