Creates various plots to visualize the results of harmonic smoothing with
topology tracking.
Usage
# S3 method for class 'harmonic_smoother'
plot(x, y = NULL, ..., type = c("topology", "extrema", "values"))
Arguments
- x
An object of class "harmonic_smoother".
- y
Ignored (included for S3 method consistency).
- ...
Additional graphical parameters passed to plot().
- type
Character string specifying the type of plot. Options are:
- "topology"
Evolution of topology differences (default)
- "extrema"
Evolution of extrema counts
- "values"
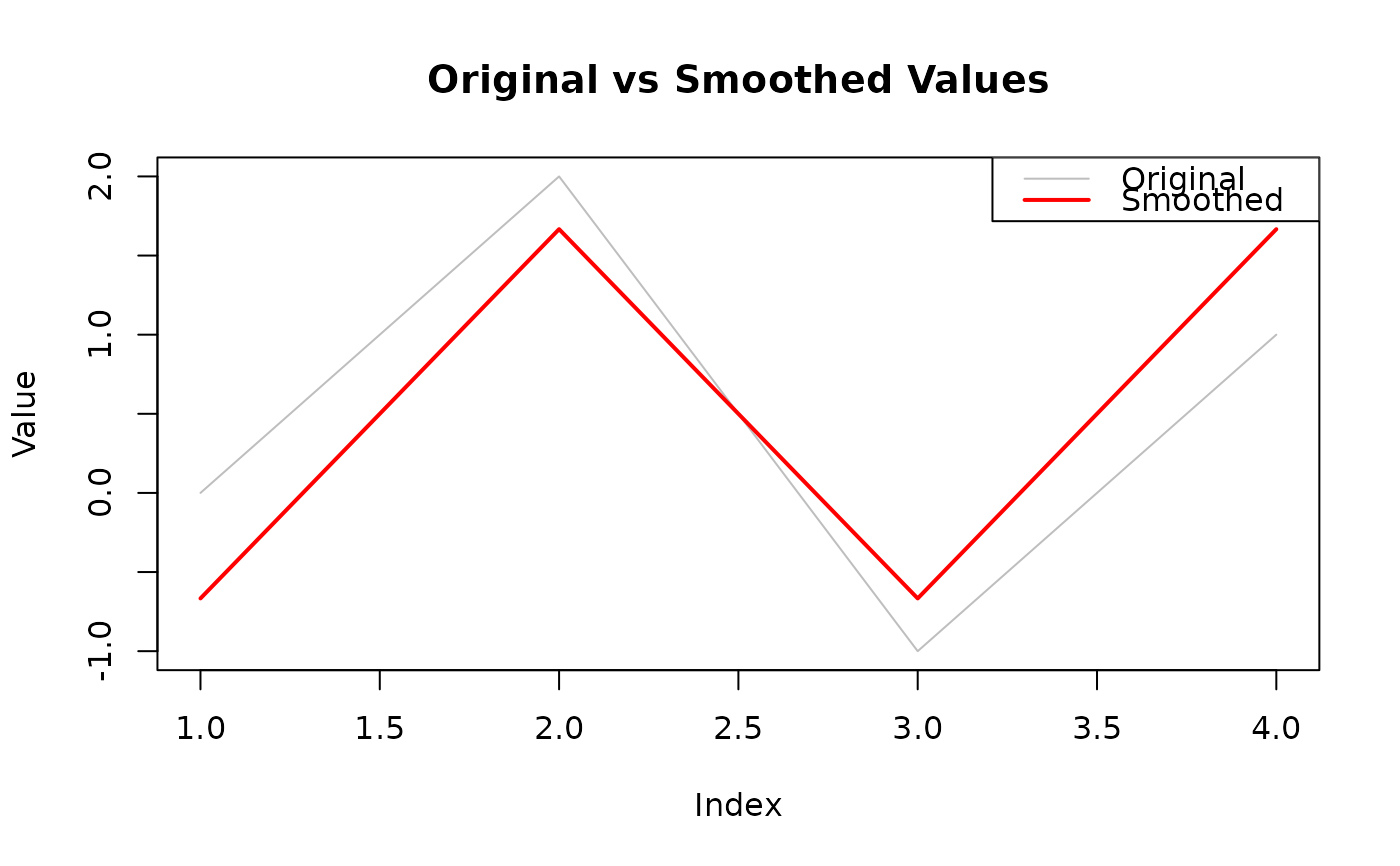
Original vs smoothed values
Value
Invisibly returns the input object.
Examples
adj.list <- list(2L, c(1L, 3L), c(2L, 4L), 3L)
weight.list <- list(1, c(1, 1), c(1, 1), 1)
values <- c(0, 2, -1, 1)
result <- harmonic.smoother(
  adj.list, weight.list, values, region.vertices = seq_along(values),
  max.iterations = 20, record.frequency = 2
)
plot(result, type = "values")