Remove Outliers from a State Space Using k-Nearest Neighbors
Source:R/outlier_detection.R
remove.knn.outliers.RdIdentifies and removes outliers from a multivariate state space based on k-nearest neighbor distances. This function implements several strategies for outlier detection, all based on the principle that outliers tend to be isolated from the main data clusters and thus have larger distances to their nearest neighbors.
Usage
remove.knn.outliers(
  S,
  y = NULL,
  p = 0.98,
  dist.factor = 100,
  k = 30,
  method = "diff.dist.factor"
)
Arguments
- S
A numeric matrix or data frame representing the state space, where each row is an observation and each column is a dimension or feature. Must contain at least
k+1observations.- y
An optional numeric vector containing values of a variable defined over the state space. If provided, must have length equal to
nrow(S). The function will filter this vector to match the filtered state space.- p
A numeric value between 0 and 1 (exclusive) indicating the percentile threshold for outlier removal. The default value of 0.98 removes points whose distance to the nearest neighbor exceeds the 98th percentile of all nearest neighbor distances.
- dist.factor
A positive numeric value used as a threshold factor in certain outlier detection methods. In "diff.dist.factor", points with relative jumps greater than this factor are considered outliers. Default is 100.
- k
A positive integer specifying the number of nearest neighbors to compute for each point. Must be less than the number of observations in
S. Default is 30.- method
A character string specifying the outlier detection method to use when k > 1. Must be one of "dist.factor", "diff.dist.factor" (default), or "default" for the unnamed method.
Value
A list of class "knn.outliers" containing the following components:
- S.q
The filtered state space matrix with outliers removed.
- y.q
The filtered dependent variable (if
ywas provided), otherwiseNULL.- nn.d
A matrix of dimensions
nrow(S)xkcontaining distances to the k nearest neighbors for each point.- d.thld
The distance threshold used for outlier detection.
- idx
A logical vector indicating which points were kept (
TRUE) and which were identified as outliers (FALSE).- n.outliers
The number of outliers detected.
- method
The outlier detection method used.
Details
The function determines outliers by analyzing the distances between points and their k nearest neighbors. Several detection methods are available:
- When k = 1:
Points are flagged as outliers if their distance to the nearest neighbor exceeds the p-th percentile threshold of all nearest neighbor distances.
- "dist.factor":
Points are considered outliers if the ratio of the k-th nearest neighbor distance to the 1st nearest neighbor distance exceeds
dist.factor.- "diff.dist.factor" (default):
For each point, finds the maximum jump in distance between consecutive neighbors, normalizes by the median jump across all points, and flags points as outliers if their relative jump exceeds
dist.factor. This method is particularly robust as it adapts to the overall distribution of distances.- Default unnamed method:
Iteratively checks if the first nearest neighbor distance exceeds the threshold or if any consecutive difference between neighbor distances exceeds the threshold.
Examples
# Create a sample dataset with outliers
set.seed(123)
n_normal <- 120
n_outliers <- 6
# Generate normal data
normal_data <- matrix(rnorm(n_normal * 2), ncol = 2)
# Generate outliers far from the main cluster
outliers <- cbind(rnorm(n_outliers, mean = 10, sd = 0.5),
rnorm(n_outliers, mean = 10, sd = 0.5))
# Combine data
S <- rbind(normal_data, outliers)
y <- c(rnorm(n_normal), rnorm(n_outliers, mean = 5))
# Remove outliers using the default method
result <- remove.knn.outliers(S, y, k = 10)
# Print summary
cat("Number of outliers detected:", result$n.outliers, "\n")
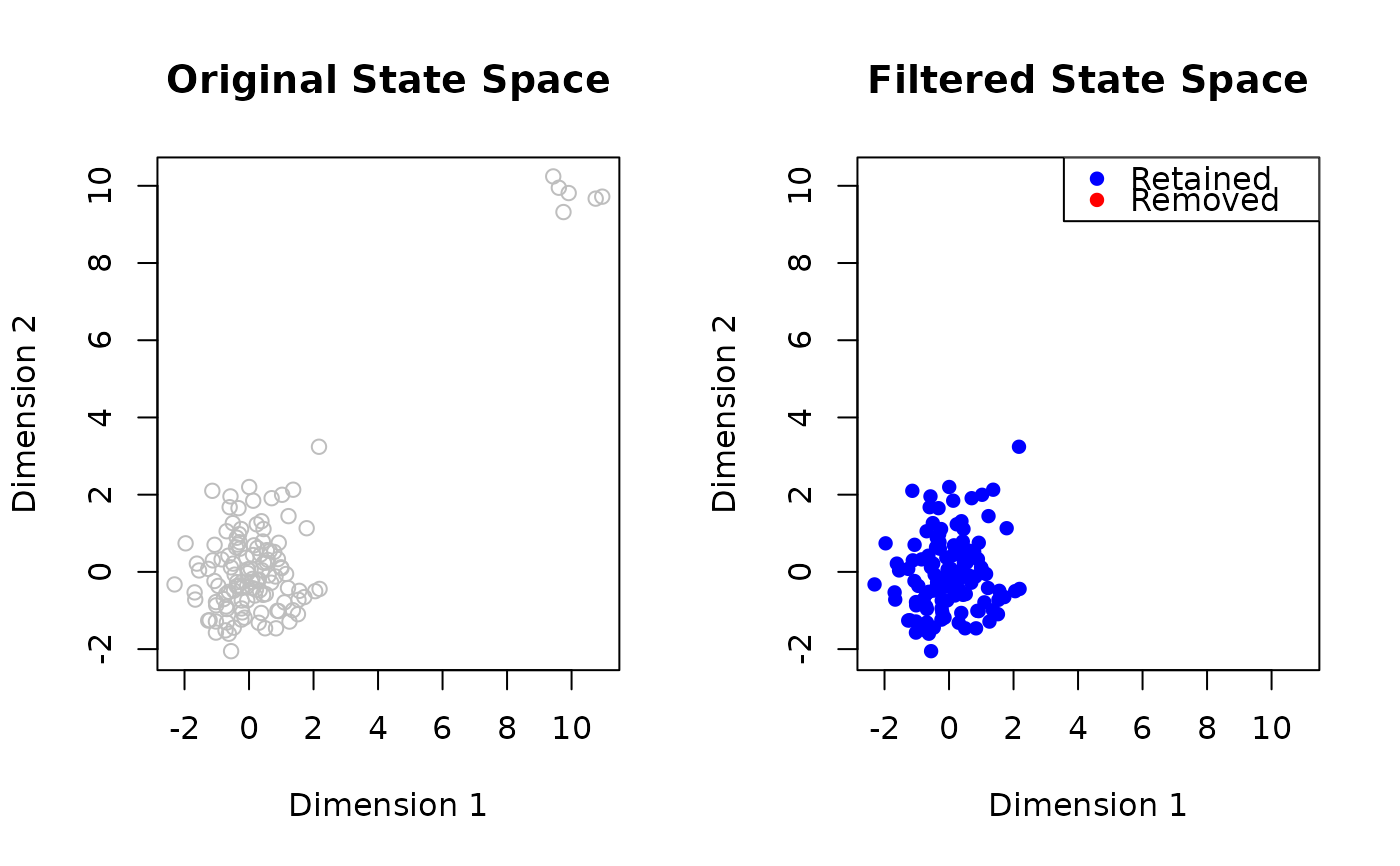
#> Number of outliers detected: 0
cat("Percentage of data retained:",
round(100 * nrow(result$S.q) / nrow(S), 2), "%\n")
#> Percentage of data retained: 100 %
# Use a different method with more conservative threshold
result2 <- remove.knn.outliers(S, y, p = 0.95, method = "dist.factor", dist.factor = 5, k = 10)
# Plot the original and filtered state space
oldpar <- par(mfrow = c(1, 2))
plot(S, col = "gray", main = "Original State Space",
xlab = "Dimension 1", ylab = "Dimension 2")
points(S[!result$idx, ], col = "red", pch = 16, cex = 1.2)
plot(result$S.q, col = "blue", pch = 16,
main = "Filtered State Space",
xlab = "Dimension 1", ylab = "Dimension 2")
legend("topright", legend = c("Retained", "Removed"),
col = c("blue", "red"), pch = 16)
 par(oldpar)