Draw each undirected edge once and color vertices by values or explicit
colors. Coordinates are computed by graph.embedding() only when absent.
Layout computation remains available separately in two or three dimensions.
Usage
# S3 method for class 'dgraph'
plot(
  x,
  coordinates = NULL,
  vertex.values = NULL,
  vertex.colors = NULL,
  vertex.size = 1,
  edge.alpha = 0.2,
  color.palette = NULL,
  main = "",
  add.legend = TRUE,
  stage = "final",
  method = c("fr", "kk"),
  edge.attribute = NULL,
  transform = c("identity", "reciprocal"),
  projection = NULL,
  ...
)
Arguments
- x
A
dgraph.- coordinates
Optional finite numeric matrix with one row per vertex and two or three columns. Row order must match graph vertex order.
- vertex.values
Optional finite numeric value per vertex, mapped through
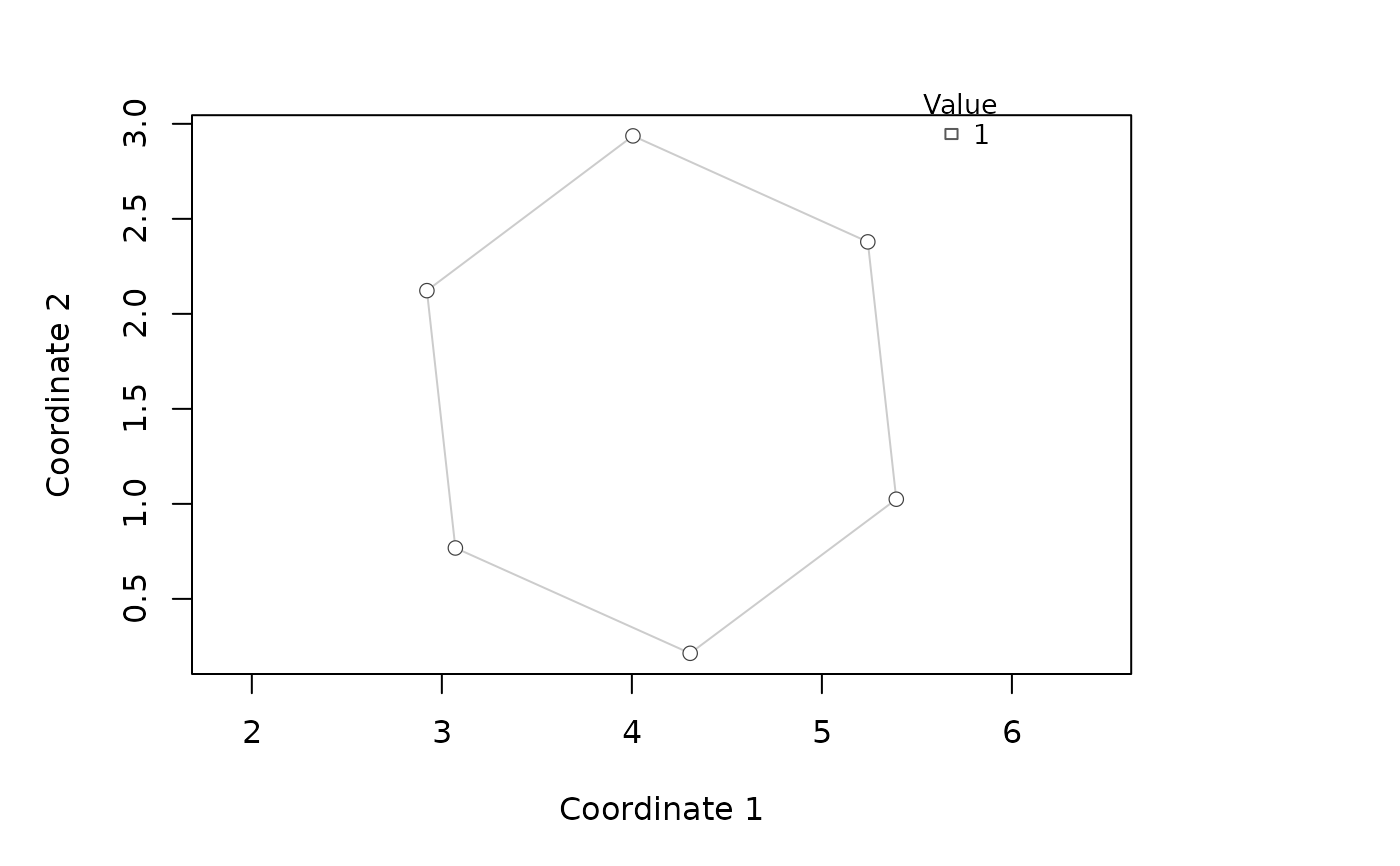
color.palette. Constant values use the palette midpoint and one legend key.- vertex.colors
Optional explicit color or vector of colors, one per vertex. Cannot accompany
vertex.values. Defaults to"steelblue".- vertex.size
Nonnegative point size, one value or one per vertex.
- edge.alpha
Edge opacity between zero and one.
- color.palette
Color vector for numeric values; defaults to a blue-white-red palette. Requires
vertex.valueswhen explicitly supplied.- main
Plot title.
- add.legend
Logical; show value/color keys for numeric
vertex.values. Explicit colors have no automatically inferred numeric legend.- stage
Stored graph stage, used for both layout and drawn edges.
- method
Layout method,
"fr"or"kk", when coordinates are absent.- edge.attribute, transform
Explicit layout edge quantity and transform; see
graph.embedding(). Layout arguments cannot accompany coordinates.- projection
For three-column coordinates, two distinct column indices to display, for example
c(1, 3). Three-dimensional input requires explicit projection; it is never silently flattened. Not used for two-column input.- ...
Named arguments to
graphics::plot.default(), such asxlim,ylim,axes,xlab,ylab, orasp. The argumentsx,yandtypeare controlled by this method and cannot be overridden.
Value
Invisibly returns the two-column coordinates actually drawn. These can be supplied to subsequent calls to reuse the layout. Graphics settings are restored after plotting.
Examples
graph <- create.graph("cycle", n = 6)
xy <- plot(graph, vertex.values = 1:6)
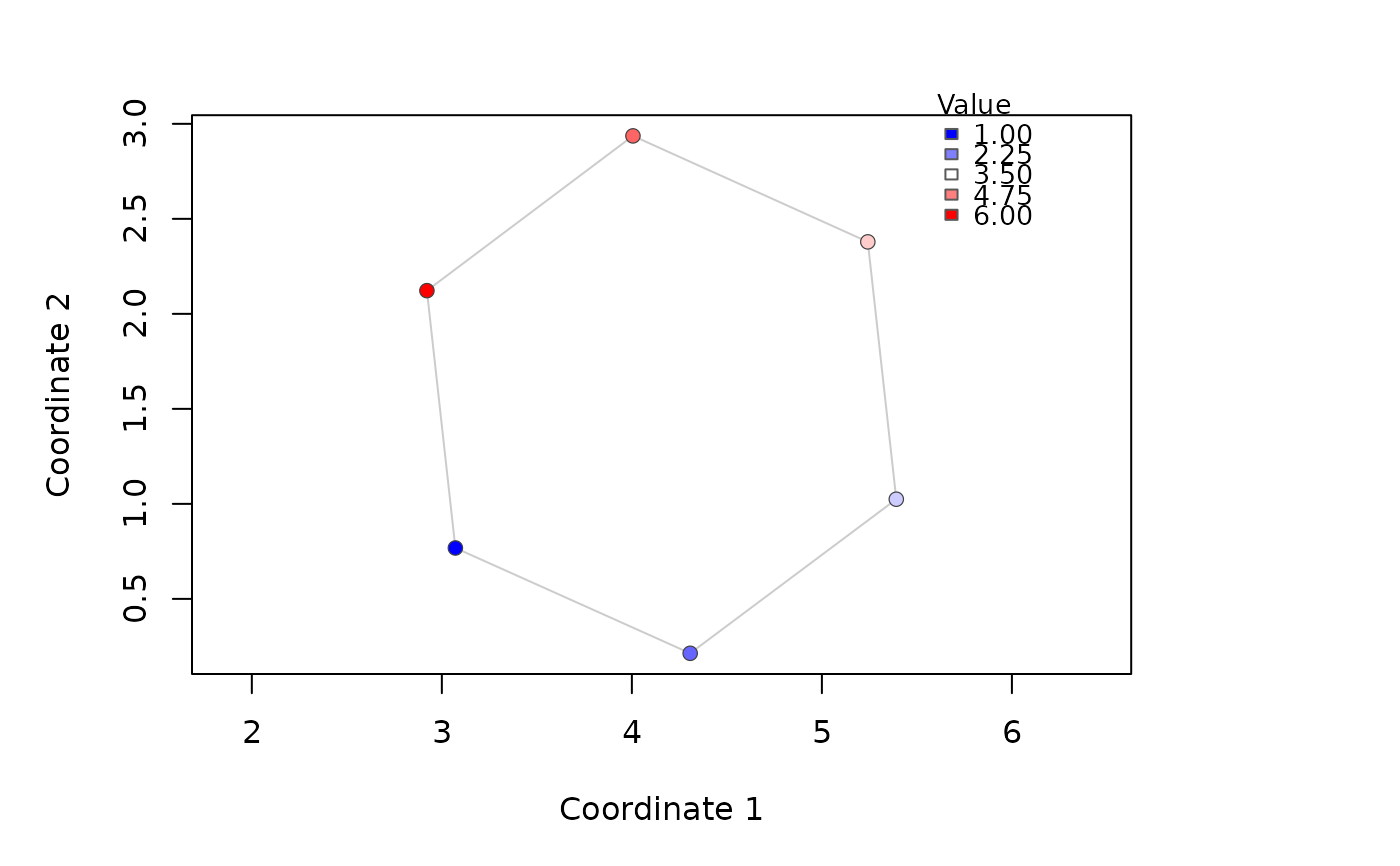 plot(graph, coordinates = xy, vertex.values = rep(1, 6))
 xyz <- graph.embedding(graph, dim = 3)
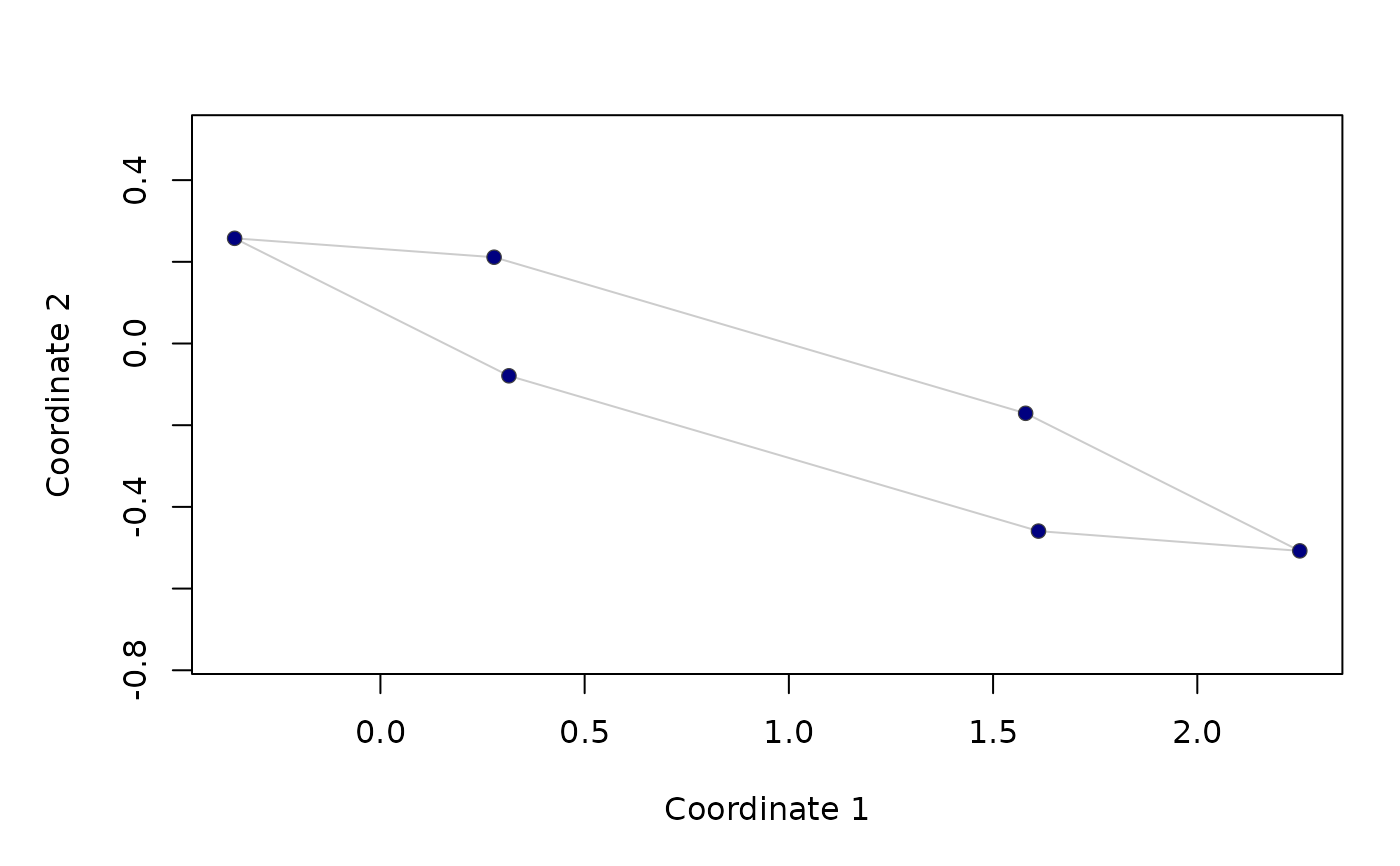
plot(graph, coordinates = xyz, projection = c(1, 3), vertex.colors = "navy")
xyz <- graph.embedding(graph, dim = 3)
plot(graph, coordinates = xyz, projection = c(1, 3), vertex.colors = "navy")