Plot method for cst_graph_mixing_stats
Usage
# S3 method for class 'cst_graph_mixing_stats'
plot(
  x,
  which = c("null.homophily", "null.assortativity", "mixing.matrix", "conductance"),
  ...
)
Arguments
- x
Object from cst.graph.mixing.stats().
- which
Character vector specifying panels to plot.
- ...
Base graphics arguments.
Value
Invisibly returns NULL after producing the requested diagnostic
panels.
Examples
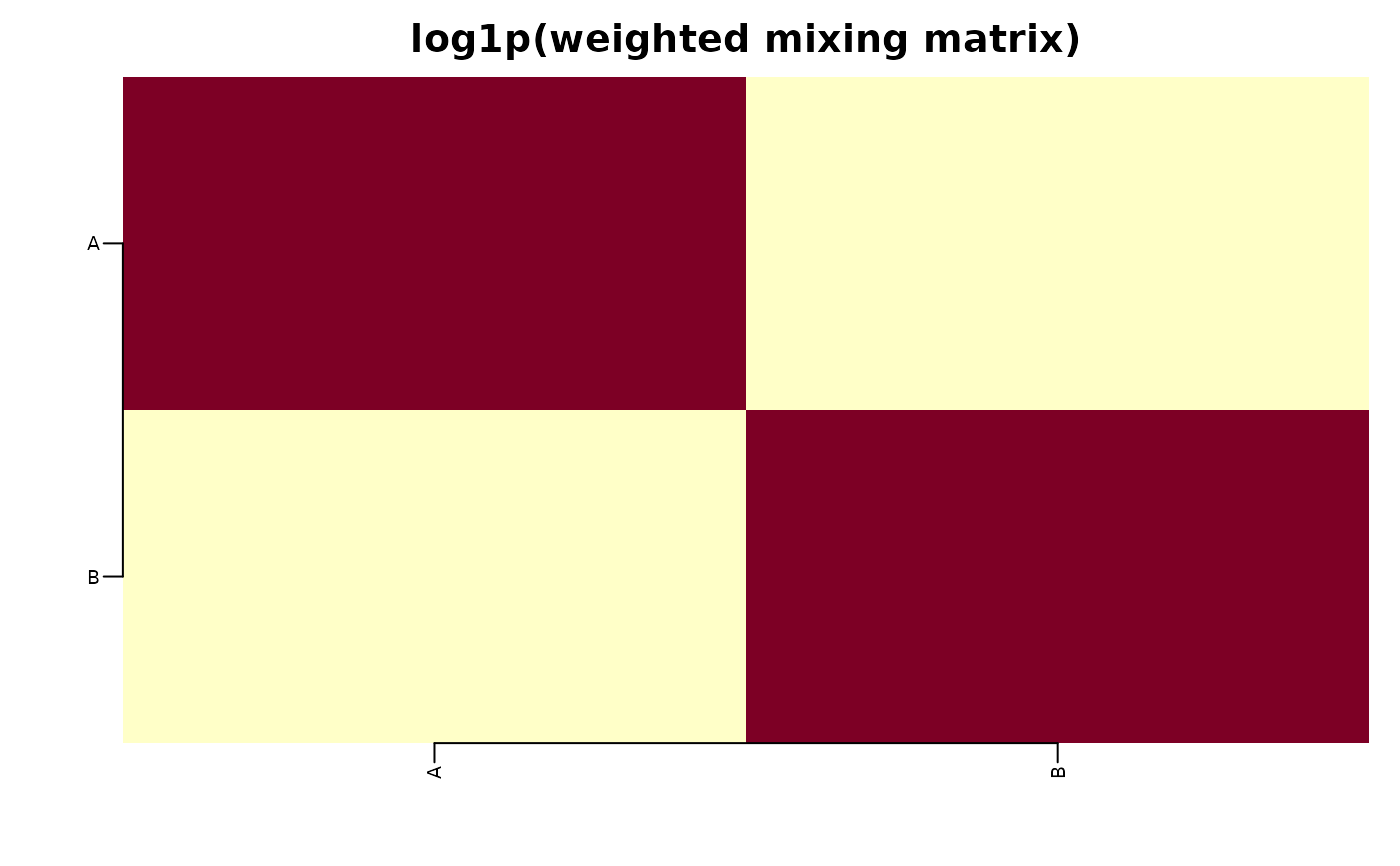
mixing <- structure(list(mixing.matrix = matrix(c(4, 1, 1, 4), 2,
  dimnames = list(c("A", "B"), c("A", "B")))),
  class = "cst_graph_mixing_stats")
plot(mixing, which = "mixing.matrix")